$1,000 Invested for 10, 20 and 30 Years: What Could Compound Growth Do?
$1,000 Invested for 10, 20 and 30 Years: What Could Compound Growth Do?
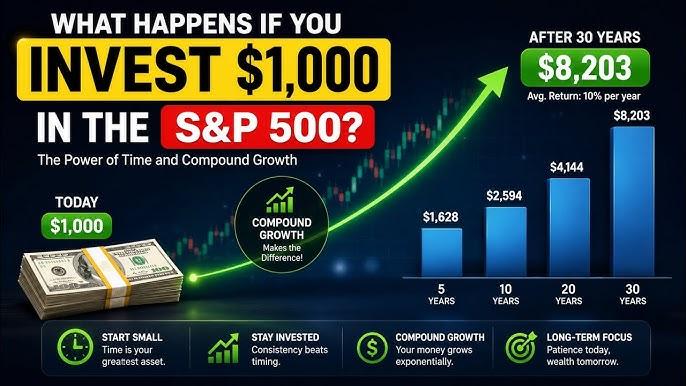
One thousand dollars is not enough to guarantee financial independence, but it is large enough to demonstrate something important: time can dramatically change what a fixed amount of invested money becomes. If growth remains invested, future returns can apply not only to the original $1,000 but also to gains accumulated in previous years.
If you invest $1,000 once and never add another dollar, the final value depends heavily on the return and how long the money remains invested.
At a hypothetical 7% annual return compounded annually:
| Time | Starting Amount | Approximate Ending Value | Approximate Growth |
|---|---|---|---|
| 10 years | $1,000 | $1,967 | $967 |
| 20 years | $1,000 | $3,870 | $2,870 |
| 30 years | $1,000 | $7,612 | $6,612 |
The original investment never changed.
What changed was the amount of time available for compound growth.
Table of Contents
How Does $1,000 Compound Over Time?
A simplified annual compound-growth formula is:
Example at 5%
After one year:
$1,000 × 1.05 = $1,050
After Two Years
$1,050 × 1.05 = $1,102.50
The second year's return is applied to $1,050 rather than only the original $1,000.
That is the core idea behind compound growth.
$1,000 Invested for 10, 20 and 30 Years at Different Returns
| Hypothetical Annual Return | 10 Years | 20 Years | 30 Years |
|---|---|---|---|
| 4% | $1,480 | $2,191 | $3,243 |
| 5% | $1,629 | $2,653 | $4,322 |
| 7% | $1,967 | $3,870 | $7,612 |
| 8% | $2,159 | $4,661 | $10,063 |
| 10% | $2,594 | $6,728 | $17,449 |
Investments do not normally produce a fixed return every year. Market losses, fees, taxes and changing economic conditions can materially alter the actual outcome.
1 What Could $1,000 Become After 10 Years?
At 4%
$1,480
At 5%
$1,629
At 7%
$1,967
At 10%
$2,594
Ten years creates meaningful growth, but this is still the earliest of our three periods.
At 7%
The original:
$1,000
has grown by approximately:
$967
It has almost doubled.

2 What Could $1,000 Become After 20 Years?
4%
$2,191
5%
$2,653
7%
$3,870
10%
$6,728
At 7%, the hypothetical balance has nearly quadrupled.
Original Money
$1,000
Approximate Growth
$2,870
By this stage, accumulated growth represents much more of the final balance than the original principal.
3 What Could $1,000 Become After 30 Years?
At 4%
$3,243
At 5%
$4,322
At 7%
$7,612
At 8%
$10,063
At 10%
$17,449
At the 7% Illustration
The original $1,000 has generated approximately:
$6,612 of hypothetical growth
No additional contribution was required for the mathematical example.
The additional decade allowed previous gains to continue participating in future growth.

The 7% Example: Where Did the Growth Come From?
| Time | Original Investment | Approximate Ending Balance | Approximate Growth |
|---|---|---|---|
| 10 years | $1,000 | $1,967 | $967 |
| 20 years | $1,000 | $3,870 | $2,870 |
| 30 years | $1,000 | $7,612 | $6,612 |
First 10 Years
Growth adds approximately:
$967
Years 11–20
The balance increases by another:
About $1,903
Years 21–30
It increases by approximately:
$3,743
Later decades can add much larger dollar amounts even when the assumed percentage return stays exactly the same.
How Much Does the Return Rate Matter?
The rate matters enormously over long periods.
After 10 Years
4% → $1,480
10% → $2,594
Difference
$1,114
After 30 Years
4% → $3,243
10% → $17,449
Difference
$14,206
A six-percentage-point difference creates a dramatically wider result after 30 years than after 10.
Investor.gov emphasizes that all investments involve risk and do not have a fixed guaranteed return. Higher expected returns can also come with greater uncertainty and larger potential losses.
Why Time Can Matter More Than the Starting Amount
Consider two people.
Person A
Invests $1,000 for 30 years
Person B
Invests $1,000 for only 10 years
At the same hypothetical 7%:
| Investor | Time | Ending Value |
|---|---|---|
| A | 30 years | $7,612 |
| B | 10 years | $1,967 |
Difference
$5,645
They invested the same initial amount.
The major difference was time.
How Many Times Could $1,000 Double?
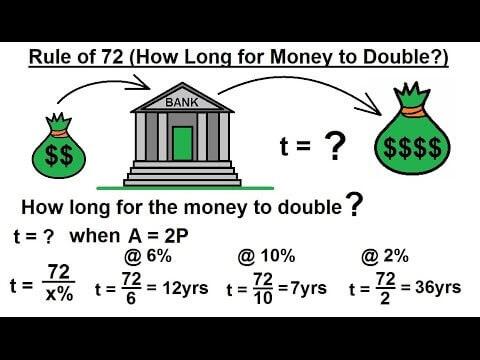
Investor.gov explains the Rule of 72 as a rough estimate of how long money might take to double at a fixed hypothetical rate.
At 4%
72 ÷ 4 ≈ 18 years
At 6%
72 ÷ 6 ≈ 12 years
At 8%
72 ÷ 8 ≈ 9 years
At 10%
72 ÷ 10 ≈ 7.2 years
Real investment markets do not produce identical annual returns, so doubling will not follow a perfectly predictable schedule.
What If You Add Monthly Contributions to the $1,000?
A one-time $1,000 investment demonstrates compounding clearly.
However, regular contributions can change the outcome much more dramatically.
Example
Starting investment:
$1,000
Monthly contribution:
$100
Time:
20 years
At a hypothetical 7%, the result would be dramatically larger than allowing only the original $1,000 to grow.
Why?
- The original $1,000 compounds.
- New money enters every month.
- Earlier contributions compound longer.
- Later contributions still add principal.
For most beginners, increasing contributions can have a much larger impact than trying to squeeze out another percentage point of return.
How Fees Can Reduce Compound Growth
A fee does more than reduce today's balance.
It can also reduce the money available to generate future returns.
Example
Suppose one portfolio effectively earns:
7% after costs
while another nets:
6%
The difference may look modest in one year.
Across 20 or 30 years, however, it can become much larger because the lower balance continues compounding from a smaller base.
Diversification, strategy, risk, tax treatment, service quality and suitability matter too.
What Inflation Does to $1,000 Over 30 Years
A future investment balance should not be viewed only in nominal dollars.
Why?
Inflation reduces purchasing power.
For example, $7,612 thirty years from now may not buy what $7,612 buys today.
Nominal Return
The percentage growth shown in your account.
Real Return
The growth remaining after considering inflation.
Taxes and Account Type Can Change the Final Result
Not every investment account is taxed the same way.
For U.S. Investors, Examples Include
- Taxable brokerage accounts
- Traditional 401(k)s
- Roth 401(k)s
- Traditional IRAs
- Roth IRAs
Different account types can affect:
- When taxes are paid
- Whether contributions are deductible
- How withdrawals are taxed
- Eligibility rules
Do not assume a projected investment balance equals the amount you will ultimately be able to spend after taxes.
Why 10% Is Not Automatically Better Than 7%
Mathematically, a higher return produces a larger ending balance.
Financially, however, investments offering greater expected returns may involve greater risk.
Ask More Than One Question
- How volatile is the investment?
- How diversified is it?
- Could you lose substantial principal?
- What fees apply?
- What is the time horizon?
- How liquid is it?
- Is the investment legitimate?
The FTC warns that scammers frequently promise big profits, guaranteed returns or little risk. Legitimate investments involve the possibility of loss.
MoneyOnliners Original Analysis: The Time-to-Growth Framework
1. Principal
How much money enters the investment?
2. Rate
What return does the investment actually produce?
3. Time
How many years does the money remain invested?
4. Retention
How much growth remains invested rather than being removed through:
- Withdrawals
- Fees
- Taxes
- Spending
MoneyOnliners Decade Growth Ratio
10 Mistakes When Thinking About $1,000 and Compound Growth
1. Assuming $1,000 Will Become a Fortune Quickly
Compounding generally needs time.
2. Treating 7% as Guaranteed
Investment returns fluctuate.
3. Assuming 10% Must Be Better
Higher expected returns can come with greater risk.
4. Ignoring Fees
Recurring costs reduce the compounding base.
5. Ignoring Inflation
Future dollars may have less purchasing power.
6. Ignoring Taxes
After-tax results can differ from headline balances.
7. Withdrawing Growth Repeatedly
This reduces future compounding potential.
8. Using Money You Need Soon
Long-term market investments can decline at inconvenient times.
9. Never Adding More Money
Regular contributions can have a much larger impact than one starting deposit.
10. Falling for Guaranteed Compound Returns
The FTC warns that guarantees of large profits and little risk are common scam signals.
Why $1,000 Invested for 10, 20 and 30 Years Matters
1. A fixed $1,000 investment makes the effect of time easy to see.
2. Compound growth lets previous returns participate in future returns.
3. Ten years can produce meaningful growth.
4. Twenty years can create a much larger difference.
5. Thirty years gives compounding far more opportunities to operate.
6. At 7%, $1,000 nearly doubles after about 10 years.
7. At the same hypothetical rate, it reaches about $3,870 after 20 years.
8. After 30 years, the hypothetical balance is about $7,612.
9. Different rates create wider gaps over longer periods.
10. A higher return is not guaranteed.
11. Investment risk remains present throughout the journey.
12. Fees reduce the money available to compound.
13. Taxes can reduce spendable wealth.
14. Inflation reduces purchasing power.
15. Adding contributions can dramatically accelerate growth.
16. Starting earlier can provide more compounding periods.
17. Diversification can reduce concentration risk.
18. Short-term market movements should not be confused with guaranteed long-term averages.
19. Scam promises of guaranteed high returns should be avoided.
20. Ultimately, looking at $1,000 invested for 10 20 and 30 years shows why time can turn a modest starting amount into a much larger balance even without additional contributions—while also showing why return assumptions must always remain realistic.
Continue Learning on MoneyOnliners
Recommended External Resources
1. Investor.gov — Compound Interest Calculator
Compound Interest Calculator — Investor.gov
Lets readers test starting amounts, contributions, estimated returns, time periods and compounding frequencies.
2. Investor.gov — What Is Compound Interest?
What Is Compound Interest? — Investor.gov
Explains interest-on-interest and the Rule of 72 with simple long-term examples.
3. Investor.gov — Introduction to Investing
Introduction to Investing — Investor.gov
Explains investment risk, compound growth and why investment returns are not guaranteed.
4. Investor.gov — Free Financial Planning Tools
Free Financial Planning Tools — Investor.gov
Provides compound-interest, savings-goal and other financial calculators.
5. Investor.gov — Diversify Your Investments
Diversify Your Investments — Investor.gov
Explains diversification and why long-term investing should not depend on one security or outcome.
6. Investor.gov — Understanding Investment Fees
Understanding Investment Fees — Investor.gov
Explains how recurring costs can reduce long-term investment growth.
7. Investor.gov — Build Wealth Over Time Through Saving and Investing
Build Wealth Over Time Through Saving and Investing — Investor.gov
Provides broader education on saving, regular investing and long-term wealth accumulation.
8. Federal Trade Commission — Investment Scams
Investment Scams — Federal Trade Commission
Explains why guarantees of large profits and little risk are major investment-fraud warning signs.
9. Federal Trade Commission — Investment Scam Warning, 2026
How to Spot and Avoid Investment Scams — FTC
Current consumer guidance covering fake returns, social-media investment pitches and fabricated investment proof.
10. Investor.gov — Use Financial Tools and Calculators
Use Financial Tools and Calculators — Investor.gov
Provides direct access to compound-interest and other investment-planning tools.
This article provides general educational information and is not individualized financial, investment, retirement, tax or legal advice. The 4%, 5%, 7%, 8% and 10% return assumptions are mathematical illustrations rather than promised investment outcomes. Investments can lose value, and fees, taxes, inflation and market volatility can materially change actual results.
Frequently Asked Questions
What happens if you invest $1,000 for 10 years?
The result depends on the return.
At a hypothetical 5%, it becomes about $1,629.
At 7%, it becomes about $1,967.
At 10%, it becomes about $2,594.
Those figures assume annual compounding and no additional contributions.
What happens if you invest $1,000 for 20 years?
At a hypothetical 5%, the balance becomes about $2,653.
At 7%, it becomes about $3,870.
At 10%, it becomes about $6,728.
Time gives previous gains more opportunities to participate in future growth.
Actual investment results will vary.
What happens if you invest $1,000 for 30 years?
At 5%, the hypothetical value is about $4,322.
At 7%, it is about $7,612.
At 10%, it is about $17,449.
The larger differences demonstrate the effect of long-term compounding.
None of these returns are guaranteed.
Can $1,000 really become $10,000?
Mathematically, yes under certain combinations of return and time.
For example, $1,000 at a hypothetical 8% annually reaches slightly above $10,000 after 30 years.
However, actual investments fluctuate.
Fees and taxes can reduce growth.
Do not treat a mathematical projection as guaranteed.
How long does $1,000 take to double?
It depends on the return.
The Rule of 72 provides a rough estimate.
At 6%, doubling takes roughly 12 years.
At 8%, roughly nine years.
Real investments do not grow at perfectly fixed rates.
Is 7% a realistic return?
Investor.gov notes that some experts use approximately 7% to 10% as a long-term educational estimate for diversified U.S. stock investing based on historical averages.
However, it also emphasizes that investments do not have a fixed return.
Some years can be negative.
Future averages may differ from historical averages.
Therefore, 7% should be treated as an assumption.
What if I leave $1,000 invested forever?
The mathematical value can continue growing if positive returns continue.
However, real investments experience market volatility.
Fees may apply.
Taxes and inflation matter too.
Long-term planning should consider all of these.
What if I add $100 per month?
Regular contributions can dramatically increase the final balance.
The original $1,000 keeps participating in growth.
Each monthly contribution adds more principal.
Earlier contributions have longer to compound.
Contribution growth can become more important than the starting amount.
What if I only save the $1,000 in cash?
If it earns no interest, the nominal balance remains $1,000.
Inflation may reduce its purchasing power over time.
A savings account may pay interest.
Market investments offer greater growth potential but involve greater risk.
Match the account to the goal.
What matters more, time or return?
Both matter significantly.
Higher returns mathematically increase growth.
Longer time creates more compounding periods.
You have more control over time and contributions than market returns.
Avoid taking excessive risk simply to increase the assumed rate.
Should I invest $1,000 all at once?
That depends on your circumstances.
First consider emergency savings.
Consider high-interest debt too.
Your investment time horizon and risk tolerance matter.
Do not invest money you may need immediately.
Can I lose the $1,000?
Yes.
Investments involve risk.
Some can lose substantial value.
Diversification can reduce certain risks but does not eliminate losses.
Avoid investments promising guaranteed profits.
Does compound growth happen every year?
The mathematics can model annual compounding.
Real market returns do not arrive smoothly.
A portfolio may gain one year and lose the next.
Long-term compounded returns emerge from the entire sequence of returns.
Therefore, fixed annual examples are simplifications.
Should fees matter on only $1,000?
Yes.
Fees may look small at first.
However, recurring costs reduce the balance available to grow.
Over decades, the lost compounding can become meaningful.
Understand costs before investing.
What is the biggest lesson from these examples?
Time can dramatically change the outcome.
The starting $1,000 matters.
The return matters too.
However, leaving gains invested for decades can be the factor that makes the difference increasingly large.
Adding future contributions can strengthen the effect even more.
Research Methodology
Primary Calculation
MoneyOnliners used the standard compound-growth formula:
Future Value = Present Value × (1 + Return)Years
Starting Principal
$1,000
Time Horizons
- 10 years
- 20 years
- 30 years
Return Assumptions
- 4%
- 5%
- 7%
- 8%
- 10%
Compounding Assumption
The primary table assumes annual compounding and no additional contributions.
Primary Educational Sources
Investor.gov was used to verify the definition of compound growth, the Rule of 72, the availability of compound-interest calculators and the fact that investments do not have guaranteed rates of return.
Why 7% and 10% Appear
Investor.gov currently notes that some experts consider roughly 7% to 10% a useful long-term estimate for diversified U.S. stocks based on historical averages, while emphasizing that actual investment returns fluctuate.
Investment Fraud Review
FTC guidance was reviewed because high compound-growth projections can be misused to promote supposedly guaranteed investment opportunities.
Original MoneyOnliners Analysis
The Time-to-Growth Framework, Decade Growth Ratio and Compound Growth Scorecard are original MoneyOnliners educational resources.
First-Hand Evidence Standard
MoneyOnliners only uses first-hand brokerage results, investment screenshots, portfolio histories or real account observations when genuine evidence exists and can be accurately documented.
No personal 10-, 20- or 30-year investment result is claimed in this article.
Limitations
Real returns vary.
Fees may reduce growth.
Taxes can affect spendable wealth.
Inflation reduces purchasing power.
Therefore, all figures in this article are educational mathematical scenarios rather than predictions.
Conclusion: The Same $1,000 Can Tell Three Very Different Stories
Consider the same starting amount:
$1,000
After 10 Years at a Hypothetical 7%
About:
$1,967
After 20 Years
About:
$3,870
After 30 Years
About:
$7,612
The Starting Amount Never Changed
Only the time did.
But Returns Matter Too
At 4%, the 30-year result is roughly $3,243.
At 10%, the mathematical result is roughly $17,449.
Those Returns Are Not Guaranteed
Real investing involves volatility and the possibility of loss.
What Can You Control More Easily?
How early you begin.
How long the money stays invested.
Whether you add future contributions.
How much you pay in fees.
How diversified you remain.
Whether you avoid unnecessary withdrawals.
Whether you reject guaranteed-return scams.
Similar Posts
Compound Interest Explained With 10 Simple Real-Life Examples
Compound Interest Explained With 10 Simple Real-Life Examples | MoneyOnliners MoneyOnliners • Wealth Building → Compound Interest Compound Interest Explained With 10 Simple Real-Life Examples Compound interest can sound like complicated financial mathematics, but the basic idea is remarkably simple: your money can earn a return, and later that return may begin earning additional returns…
How Long Does It Take to Double Your Money? The Rule of 72 Explained
How Long Does It Take to Double Your Money? The Rule of 72 Explained | MoneyOnliners MoneyOnliners • Compound Growth → Rule of 72 How Long Does It Take to Double Your Money? The Rule of 72 Explained If your money is growing at 4%, 6%, 8% or 10% a year, how long might it…
10 Compound Interest Mistakes That Can Give You Unrealistic Expectations
10 Compound Interest Mistakes That Can Give You Unrealistic Expectations | MoneyOnliners MoneyOnliners • Compound Interest → Reality Check 10 Compound Interest Mistakes That Can Give You Unrealistic Expectations Compound interest is one of the most useful ideas in long-term finance, but it is also one of the easiest to misunderstand. A calculator can make…
Can Compound Interest Make You a Millionaire? Let’s Look at the Numbers
Can Compound Interest Make You a Millionaire? Let’s Look at the Numbers | MoneyOnliners MoneyOnliners • Compound Interest → Millionaire Math Can Compound Interest Make You a Millionaire? Let’s Look at the Numbers Becoming a millionaire through compound growth is mathematically possible, but the word “millionaire” can make the process sound easier than it really…
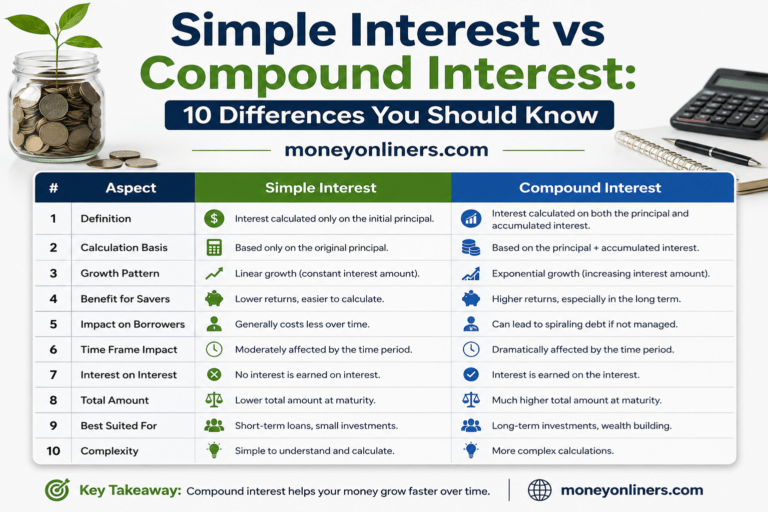
Simple Interest vs Compound Interest: 10 Differences You Should Know
Simple Interest vs Compound Interest: 10 Differences You Should Know | MoneyOnliners MoneyOnliners • Compound Interest → Comparison Guide Simple Interest vs Compound Interest: 10 Differences You Should Know Simple interest and compound interest can start with the same principal and the same stated rate yet produce different results. The difference comes from what the…
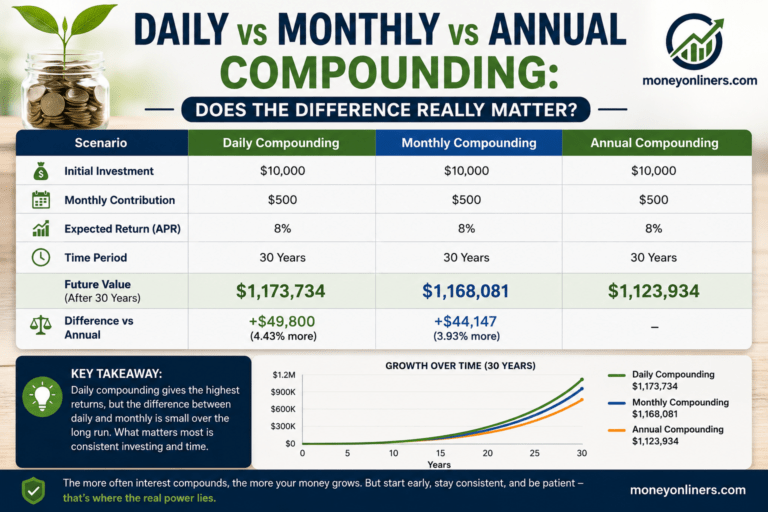
Daily vs Monthly vs Annual Compounding: Does the Difference Really Matter?
Daily vs Monthly vs Annual Compounding: Does the Difference Really Matter? | MoneyOnliners MoneyOnliners • Compound Interest → Frequency Comparison Daily vs Monthly vs Annual Compounding: Does the Difference Really Matter? Daily compounding sounds much more powerful than monthly or annual compounding. Mathematically, more frequent compounding does create a larger ending balance when the principal,…